I've been entranced with astronomy for what, 45 years now, and one of the most amazing things is that it is one of the few sciences, if not THE only science, where you cannot touch or examine up-close what you are studying. Sure these days, we are sending probes to Mars and have samples from the moon and we're working on asteroid samples, but as far as stars-and-galaxies astronomy, examining them through a telescope is the best you can do.
But wait - while we can't get a piece of a distant star in the lab, we know what elements they are composed of, their temperature and how fast they are moving and rotating - how do we know that? The answer is in analysis of the light using spectroscopy. Break the light into a spectrum using a prism or diffraction grating converts it into a rainbow of colors. So far, so good... The image at left shows what happens with luminous bodies - a hot object such as a tungsten filament or a star will produce a pure continuous spectrum. Add an atmosphere to the star and the atoms and molecules of gas absorb particular wavelengths of the light and produce an absorption line spectrum. A hot gas cloud will produce an emission spectrum - again, the atoms and molecules emitting certain wavelengths of light. While beyond the scope of this blog, elements absorb or emit very specific wavelengths as the electrons move between energy levels. We can observe a particular red emission line in the laboratory spectrum of hydrogen, and see the very same wavelength in a cloud of hydrogen thousands or millions of light years away, or if the star has hydrogen in its atmosphere, it might appear dark against the star's spectrum at the same wavelength. By inference then, we can identify the elements in distant stars and galaxies from these spectral signatures. Add to this that motion towards or away from us can produce
Doppler shifts - slight wavelength shifts to the blue as the object approaches, to the red if it is receding, and we know a LOT more about the universe!
I've
posted some of these before - spectra of stars taken with a glass prism and telephoto lens. It was good enough to show a few dozen absorption lines in a spectrum of a star in the Hyades star cluster with my camera's zoom lens. I was thinking that with a longer focal length, it might have higher spectral resolution. When I made the prism mount for the post above back 3 years ago, I left space to use my little Meade 80mm F/6 scope, a 480mm focal length lens, shown at left. I'm still amazed that a sloped slab of glass (cut, ground and polished myself over a couple weekends) shows the makeup of distant stars. Perhaps I'm just easily impressed!
Anyway, the other morning when I
went up early to image C/2013 R1 Lovejoy, I tried the combo for the first time. Since the prism introduces a considerable shift to where the scope needs to be aimed, it took some practice to find some objects, first up being the bright star Arcturus rising in the east. Once the offset was taken into account, the spectrum was focused to a point using live view, and some exposures tried. The spectra look better when widened a little bit, so I moved the scope at a slow rate while taking the 15 second exposure. The absorption lines came out well - and the cool giant star, spectral class K1.5III, cooler than the sun, but slightly larger and much more luminous. Identifications of the lines are not straightforward because the prism has a non-linear dispersion. The dark line near the red limit is likely Hydrogen-Alpha, and the doublet line in the yellow is likely the sodium doublet, but I'd have to work to identify others... Don't forget that the element helium was discovered on the sun in the solar spectrum before it was discovered on Earth!

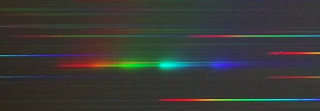
As a demonstration of different types of spectrum, I swung over and took a shot of the Orion Nebula, a mostly-hydrogen gas cloud and star formation area. Of course, the resultant spectrum type is an emission nebula, since the gas is heated to fluorescence by hot stars inside the cloud. Since the nebula has a considerable diameter, monochromatic images of the nebula occur along the spectrum. Since the cloud is mostly Hydrogen, line identification is easier! The left-most red image of the nebula is the H-alpha line - the principle hydrogen emission in the visible part of the spectrum. Of the three greenish-blue images in the center the rightmost is H-beta, the left 2 from triply ionized oxygen. The faint image to the very far right is likely H-gamma hydrogen line, and the faint orange image to left center is likely a helium line.
And then, of course, the reason I practiced earlier in the evening before the comet rose, getting a spectrum of Comet Lovejoy itself! While the comet was still too low to image, I took a dozen frames of the spectrum from 1.5 to 3 minutes and stacked them to improve the signal. Since a comet is a "dirty snowball" at most a mile or two in diameter, the part that we see is mostly sublimated gas from the sun-melted ices from the nucleus. The solar radiation dissociates the molecules (breaks up) and an emission line spectrum results. Instead of single wavelength emission though, the larger, more complicated molecules have emission bands shown here. The green, aqua and blue emission bands are from diatomic carbon molecules, the much fainter bands in the orange and red are from ammonia. I was hoping to catch some of the tail features, but the brightness wasn't quite high enough to detect it...
So it was a great evening to tryout the new scope/prism combo and it came out fine. Of course, I'm spending much more time manipulating and describing the images than what it took to take the 3 spectra! Anyway, hope you enjoy!


No comments:
Post a Comment